
- Home
- Services
- Asphalt Roads and Surfaces
- Survey Profilograph & Design
Survey Profilograph & Design
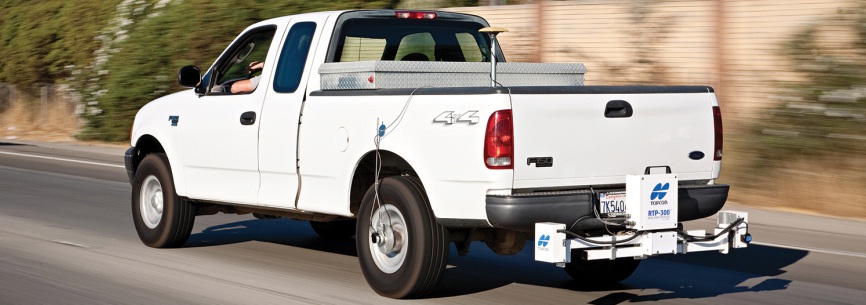
Synergy’s Survey Profilograph vehicle provides an accurate high speed representation of the longitudinal and cross sectional change in grade for pavements of any type. Not only is the system is perfect for checking the geometric shape of an existing surface but it also calculates the current ride qualities too. As a mobile surveying vehicle, the system generates a higher resolution topography map than conventional surveying methods in a fraction of time.
Used on any type of surface, including roads, airport runways and bridge decks, the collected road profile data can be used in “what if” scenario analysis and the subsequent creation of an improved smoothed surface profile design.
Using this design in conjunction with Synergy’s PaveSmart asphalt paver and milling machine automated grade system provides absolute control for asphalt paving and, or milling work.
Not only is a smooth riding, geometrically correct surfaces guaranteed, there are no surprises in the total tones of allowed volume of asphalt laid.
The Survey Profilograph from Synergy allows the vehicle to be used in a number of scenarios which are explained below.
1. Checking the Ride
The Survey Profilograph results can be displayed as a NAASRA, PRI and IRI format including an output that details the horizontal and vertical position’s highlighting potential problems an interactive what if interface allows you to evaluate several alternate remedial scenarios to allowing you to choose the optimal solution.
2. Refurbishing Existing Pavement
Using a high speed Profilograph saves you up to 95% of survey cost without the risks associated with working on an active highway, and provides design depths for paving and/or milling. This significantly improves the geometric shape of the pavement resulting with increased longevity.
3. New Works
In the scenario where design depths and readability are the top priorities and absolute levels are secondary, this system will save costs on surveying and overspread of materials while still maintaining minimum design depths and producing a smooth ride.
The Survey Profilograph seven sensors and high-precision accelerometer record a measurement at every increment of the chainage (station), approximately every 30 cm, and from this data the relative change in grade is calculated.
The value of the Profilograph system is most evident during the design phase due to its simplicity, efficiency and accuracy. The specialist CAD design software designed by Synergy is used to process the collection data. Once the processed data is opened in the design application, the user is presented with a graph of the surface and the bump counts for each 100m section, displayed in PRI, NAASRA or IRI format.
From this view, the user can export a bump count, select the most appropriate settings to suit the project, and enter the “Design” view. This view allows the user to enter the design specifications for the project and shows a plot of the existing surface and this view allows the user to enter the design specifications, maximum and minimum depths, cross fall allowances, ride calculation and overall asphalt volume analysis.
Related Case Studies
-
Downer engages Synergys’ PaveSmart Grade Control
Downer recently engaged Synergy Positioning Systems’ survey consultancy service and PaveSmart grade control system to ensure time and cost savings on resurfacing a lengthy section of Christchurch arterial road....
Read More